Powertools for AWS Lambda - Best Practices By Default
AWS Lambda Powertools for Python is the library I add to every Lambda function before writing a single line of business logic. While Powertools is also available for TypeScript, Java, and .NET, this post focuses on the Python edition. Three decorators give you structured logging, distributed tracing, and CloudWatch metrics. The rest of the toolkit - event routing, idempotency, batch processing, parameter management - eliminates the boilerplate that otherwise dominates serverless code. As of early 2026, Powertools v3.25.0 supports Python 3.10 through 3.14, and with the X-Ray SDK entering maintenance mode on February 25, 2026, Powertools Tracer is one of the recommended migration paths for Lambda tracing - alongside AWS Distro for OpenTelemetry (ADOT) and native OpenTelemetry instrumentation.
I wanted to consolidate everything I've learned from using Powertools across real projects into one place. This blog post is a deep dive into what Powertools offers, how I use it in production, and how you can adopt it today.
Why Observability Matters for Serverless
Serverless architectures introduce unique observability challenges. There aren't any servers to SSH into, no log files to tail, and no process monitors to check. When something goes wrong at 2 AM, your only window into the problem is what your functions chose to emit.
Four problems hit every Lambda team eventually:
- Unstructured logs -
print()statements scattered through code produce text that's nearly impossible to search, filter, or alert on at scale. - Missing correlation - When a single user request touches five Lambda functions, connecting the dots across CloudWatch log groups requires manual effort or custom correlation IDs.
- Manual metrics - Calling
put_metric_datadirectly means writing boto3 code, handling batching, and dealing with CloudWatch API limits. - Tracing gaps - Setting up X-Ray manually with the SDK requires segment management, subsegment creation, and careful exception handling in every function.
Multiply these across dozens of functions and you get a codebase where observability code outweighs business logic.
The Problem Without Powertools
This is what observability code typically looks like without Powertools - a pattern I see in many Lambda projects:
import logging
import json
import time
import boto3
from aws_xray_sdk.core import patch_all, xray_recorder

patch_all()
logger = logging.getLogger()
logger.setLevel(logging.INFO)
cloudwatch = boto3.client('cloudwatch')

def lambda_handler(event, context):
    # Manual structured logging
    logger.info(json.dumps({
        "message": "Processing request",
        "request_id": context.aws_request_id,
        "function_name": context.function_name,
        "event": event
    }))

    # Manual X-Ray subsegment
    subsegment = xray_recorder.begin_subsegment('process_data')
    try:
        result = process_data(event)
        subsegment.put_annotation('status', 'success')
    except Exception as e:
        subsegment.put_annotation('status', 'error')
        raise
    finally:
        xray_recorder.end_subsegment()

    # Manual CloudWatch metric
    cloudwatch.put_metric_data(
        Namespace='MyApp',
        MetricData=[{
            'MetricName': 'ProcessedItems',
            'Value': 1,
            'Unit': 'Count'
        }]
    )

    return result
That's 40+ lines of infrastructure code before you write any business logic. It's error-prone - forget to end a subsegment and your traces break. It's inconsistent - each developer formats logs differently. And it makes an API call for every metric, adding latency and cost.
What is AWS Lambda Powertools?
AWS Lambda Powertools is an open-source toolkit maintained by AWS that provides a suite of utilities for Lambda functions. It's available for Python, TypeScript, Java, and .NET - the core patterns (Logger, Tracer, Metrics) are consistent across all languages. It's not a framework - it's a collection of independent utilities you adopt incrementally.

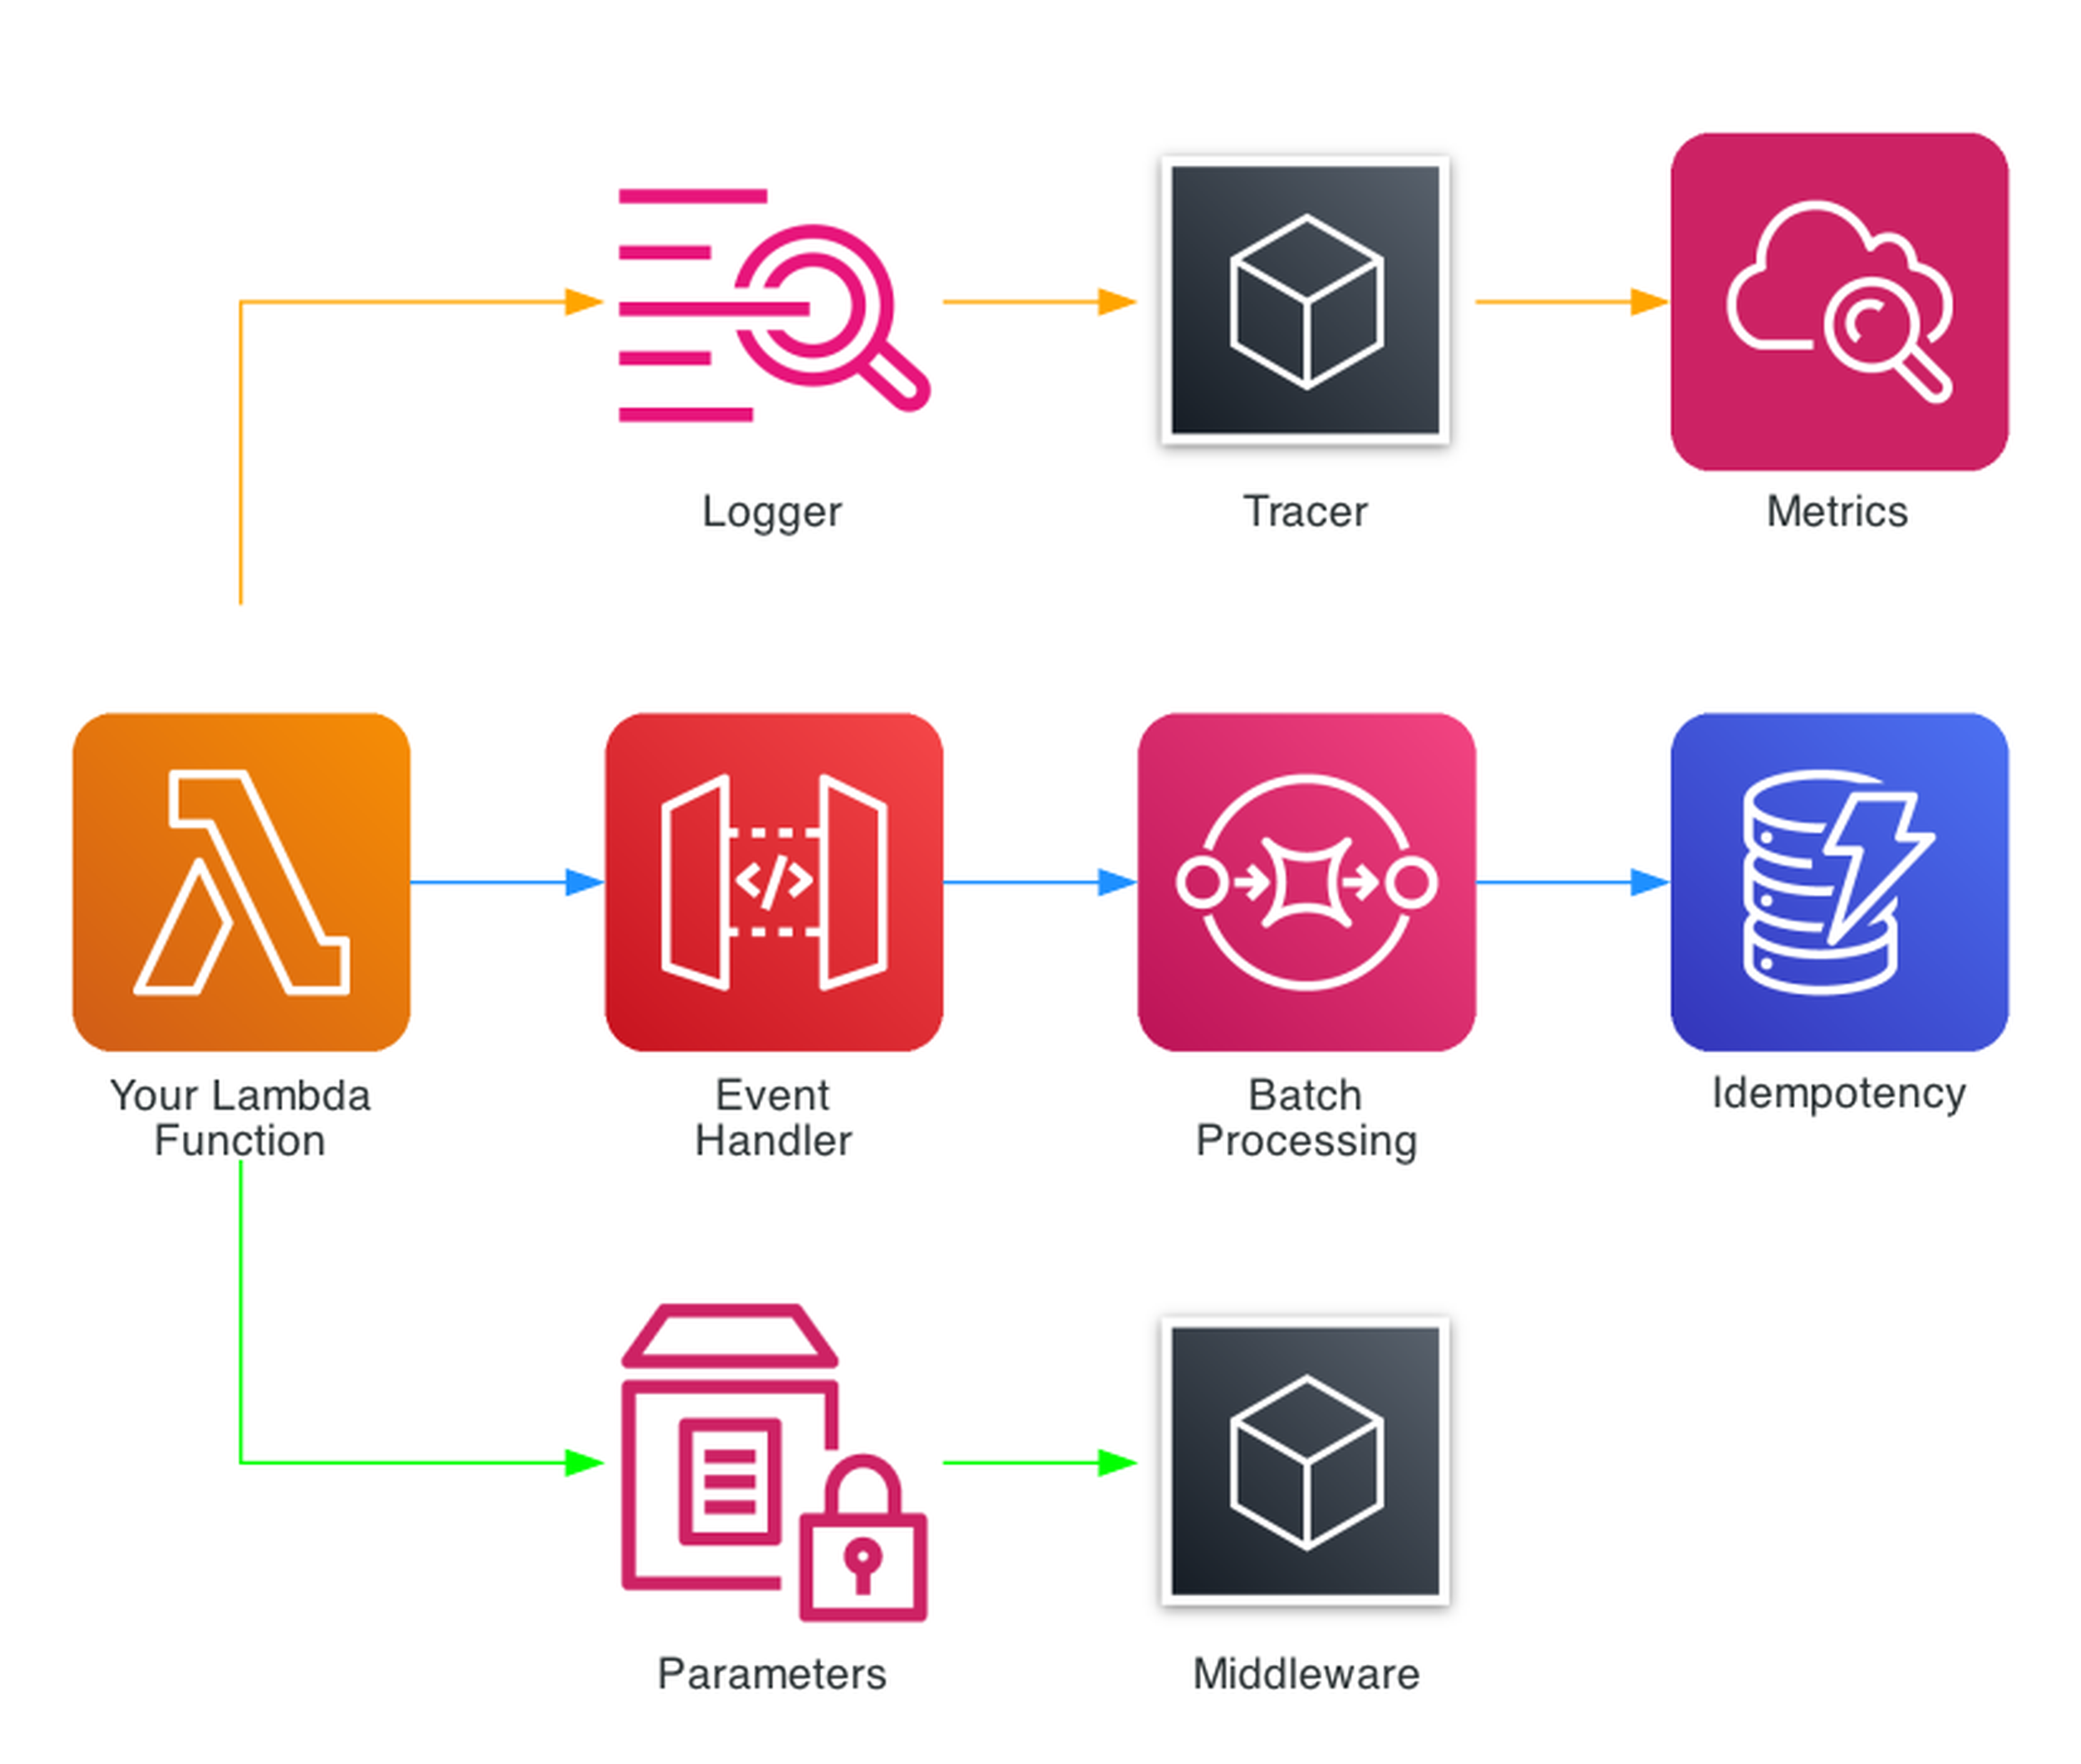
The toolkit includes a growing suite of utilities organized into categories:
Core Observability (The Big Three)
- Logger - Structured JSON logging with automatic Lambda context injection
- Tracer - AWS X-Ray tracing via decorators with automatic annotation
- Metrics - CloudWatch Embedded Metric Format (EMF) for zero-latency custom metrics
Event Handling
- Event Handler - REST, HTTP, and GraphQL routing for API Gateway, ALB, and Lambda Function URLs
- Batch Processing - SQS, Kinesis, and DynamoDB Streams with partial failure reporting
- Kafka Consumer - MSK and self-managed Kafka with automatic JSON, Avro, and Protocol Buffer deserialization
- Event Source Data Classes - Typed access to event payloads from 20+ AWS services
Data & Validation
- Parser - Pydantic v2 models for event validation and transformation
- Idempotency - At-most-once execution with DynamoDB-backed deduplication
- Data Masking - PII redaction in logs and traces
Configuration
- Parameters - SSM Parameter Store, Secrets Manager, AppConfig, and DynamoDB with caching and transformation
- Feature Flags - AppConfig-backed feature toggles with rule evaluation
Utilities
- Middleware Factory - Custom middleware with before/after hooks
- JMESPath Functions - Built-in JMESPath custom functions for extracting data from complex event structures
- Typing - LambdaContext type for IDE autocompletion
- Streaming - S3 object streaming for large file processing without loading entire objects into memory
Installation and Setup
Powertools can be added three ways:
Lambda Layer (Recommended for production)
The fastest approach - no bundling required:
arn:aws:lambda:{region}:017000801446:layer:AWSLambdaPowertoolsPythonV3-{python_version}-{arch}:{version}
For example, Python 3.13 on ARM64:
arn:aws:lambda:us-east-1:017000801446:layer:AWSLambdaPowertoolsPythonV3-python313-arm64:29
pip / uv
pip install aws-lambda-powertools
# Or with uv:
uv add aws-lambda-powertools

# With Pydantic for Parser utility:
pip install "aws-lambda-powertools[parser]"
# With all optional dependencies:
pip install "aws-lambda-powertools[all]"
Environment Variables
Three environment variables configure the core utilities across all functions:
POWERTOOLS_SERVICE_NAME=my-service        # Appears in every log entry and metric
POWERTOOLS_METRICS_NAMESPACE=MyApp        # CloudWatch metrics namespace
POWERTOOLS_LOG_LEVEL=INFO                 # Log level (DEBUG, INFO, WARNING, ERROR)
Logger - Structured Logging
The Logger utility replaces Python's standard logging with structured JSON output. Every log entry automatically includes the Lambda request ID, function name, memory allocation, cold start status, and sampling rate.
I use it like this in the Smurf ETL project's process-upload function:
from aws_lambda_powertools import Logger
from aws_lambda_powertools.utilities.typing import LambdaContext

logger = Logger()

@logger.inject_lambda_context(log_event=True)
def lambda_handler(event, context: LambdaContext):
    logger.info("Processing file", extra={
        "file_name": filename,
        "bucket": bucket_name
    })
The @logger.inject_lambda_context decorator automatically adds Lambda context to every log entry. Setting log_event=True logs the entire incoming event on the first line - invaluable for debugging. The extra parameter adds custom fields that become searchable in CloudWatch Logs Insights.
A single log entry produces JSON like:
{
    "level": "INFO",
    "location": "lambda_handler:119",
    "message": "Processing file",
    "timestamp": "2026-01-15T10:30:00.000Z",
    "service": "sales-data-platform",
    "cold_start": true,
    "function_name": "process_upload",
    "function_request_id": "c6af9ac6-7b61-11e6-9a41-93e8deadbeef",
    "file_name": "store_0001_2026-01-15.json",
    "bucket": "sales-data-uploads"
}
Every field is searchable. In CloudWatch Logs Insights:
fields @timestamp, message, file_name
| filter service = "sales-data-platform"
| filter level = "ERROR"
| sort @timestamp desc
Key Logger Features
- Correlation IDs - Automatically propagates correlation IDs across Lambda invocations via API Gateway headers, SQS messages, or custom sources
- Child loggers -
logger.child(extra={"module": "parser"})creates loggers that inherit the parent context - Sampling -
Logger(sampling_rate=0.1)logs DEBUG for 10% of invocations without changing code - Exception logging -
logger.exception("Error")automatically includes the full stack trace as structured data
Tracer - Distributed Tracing
The Tracer utility wraps AWS X-Ray with a decorator-based approach that eliminates manual segment management.
From the Account Watcher project:
from aws_lambda_powertools import Tracer

tracer = Tracer()

@tracer.capture_method
def parse_event(event):
    """Parse details of event"""
    # ... business logic ...
    return eventName, result

@tracer.capture_method
def send_slack_message(payload, webhook):
    """Send Slack message"""
    return requests.post(webhook, data=json.dumps(payload))

@tracer.capture_lambda_handler
def lambda_handler(event, context):
    event_name, event_detail = parse_event(event)
    send_slack_message({"text": f"{event_name}: {event_detail}"}, webhook)
@tracer.capture_lambda_handler creates the root X-Ray segment. @tracer.capture_method creates subsegments for each decorated function. Exceptions are automatically captured as fault annotations.
Key Tracer Features
- Automatic patching - Patches boto3, requests, and other libraries for downstream tracing
- Annotations and metadata -
tracer.put_annotation("order_id", "123")for searchable fields,tracer.put_metadata("response", data)for detailed inspection - Async support - Works with asyncio functions via
@tracer.capture_method - Provider pattern - Swap X-Ray for OpenTelemetry when the native integration ships
A note on the future of tracing: With the X-Ray SDK now in maintenance mode (February 2026), the Powertools team has an active RFC for native OpenTelemetry support in the Tracer utility. When this ships, Tracer will support any OTLP-compatible backend (Datadog, Honeycomb, Grafana, Jaeger) without changing your application code. If you adopt @tracer.capture_lambda_handler today, your tracing code will transition automatically when the OTel backend lands.
Metrics - CloudWatch Embedded Metric Format
The Metrics utility uses CloudWatch Embedded Metric Format (EMF) to publish custom metrics with zero API calls. Metrics are embedded in log output and extracted asynchronously by CloudWatch - no put_metric_data calls, no latency impact, no API throttling.
From the Smurf ETL process-upload function:
from aws_lambda_powertools import Metrics
from aws_lambda_powertools.metrics import MetricUnit

metrics = Metrics()

@metrics.log_metrics(capture_cold_start_metric=True)
def lambda_handler(event, context):
    # Business logic...
    metrics.add_metric(name="FilesProcessed", unit=MetricUnit.Count, value=1)
    metrics.add_metric(name="RecordsProcessed", unit=MetricUnit.Count, value=len(df))
capture_cold_start_metric=True automatically tracks cold starts per function - one of the most useful metrics for Lambda performance tuning.
From the detect-anomalies function, adding dimensions for more granular metrics:
metrics.add_metric(name="AnomaliesDetected", unit=MetricUnit.Count, value=len(anomalies))
metrics.add_metric(name="BedrockInvocations", unit=MetricUnit.Count, value=1)
metrics.add_dimension(name="ModelId", value=BEDROCK_MODEL_ID)
Dimensions let you filter and group metrics in CloudWatch. Here the ModelId dimension means you can see invocation counts per Bedrock model.
Key Metrics Features
- Zero latency - EMF metrics are extracted from logs, not from API calls
- Auto-flush -
@metrics.log_metricsensures metrics are flushed even if the function throws - Default dimensions - Set once, applied to all metrics:
metrics.set_default_dimensions(environment="prod") - High resolution - Supports 1-second resolution metrics via
resolution=MetricResolution.High - Validation - Raises
SchemaValidationErrorif you exceed CloudWatch limits (30 dimensions, 1000 metrics per EMF blob) - Datadog provider - Powertools v3 also supports Datadog as an alternative metrics backend via
DatadogProvider, using the sameadd_metricAPI
The Big Three Together
The real power of Powertools emerges when Logger, Tracer, and Metrics work together. The pattern I use across all 17 functions in the Smurf ETL project looks like this:
from aws_lambda_powertools import Logger, Tracer, Metrics
from aws_lambda_powertools.metrics import MetricUnit
from aws_lambda_powertools.utilities.typing import LambdaContext

logger = Logger()
tracer = Tracer()
metrics = Metrics()

@logger.inject_lambda_context(log_event=True)
@tracer.capture_lambda_handler
@metrics.log_metrics(capture_cold_start_metric=True)
def lambda_handler(event, context: LambdaContext):
    # All three utilities active with 3 lines of decorators
    logger.info("Processing started")
    # ... business logic with @tracer.capture_method on helper functions ...
    metrics.add_metric(name="ItemsProcessed", unit=MetricUnit.Count, value=count)

Three decorators. Structured JSON logs with Lambda context. X-Ray traces with automatic subsegments. CloudWatch metrics with cold start tracking. All correlated by the same request ID.
This pattern is used across all 17 Lambda functions in the Smurf ETL project. The consistency means every function produces the same log format, the same trace structure, and the same baseline metrics.
Event Handler - REST Routing
The Event Handler utility provides Flask-like routing for API Gateway, ALB, and Lambda Function URLs. Instead of a monolithic handler with if/elif chains, you define routes with decorators.
from aws_lambda_powertools.event_handler import APIGatewayRestResolver

app = APIGatewayRestResolver()

@app.get("/items")
def list_items():
    return {"items": get_all_items()}

@app.post("/items")
def create_item():
    body = app.current_event.json_body
    item = save_item(body)
    return {"item": item}, 201

@app.get("/items/<item_id>")
def get_item(item_id: str):
    item = find_item(item_id)
    if not item:
        raise NotFoundError(f"Item {item_id} not found")
    return {"item": item}

def lambda_handler(event, context):
    return app.resolve(event, context)

Resolvers are available for REST API (APIGatewayRestResolver), HTTP API (APIGatewayHttpResolver), ALB (ALBResolver), Lambda Function URL (LambdaFunctionUrlResolver), and VPC Lattice (VPCLatticeV2Resolver).
Key Event Handler Features
- Path parameters -
<item_id>with type hints for automatic validation - CORS - Built-in CORS configuration with
CORSConfig - Middleware - Per-route middleware for auth, validation, and logging
- Exception handling - Custom exception handlers for consistent error responses
- OpenAPI - Automatic OpenAPI schema generation from route definitions
- Compression - Automatic gzip compression for responses
Parameters - SSM, Secrets Manager, and More
The Parameters utility provides a unified interface for retrieving configuration from SSM Parameter Store, Secrets Manager, AppConfig, and DynamoDB - with built-in caching and transformation.
from aws_lambda_powertools.utilities import parameters

# SSM Parameter Store (cached for 5 minutes by default in v3)
api_url = parameters.get_parameter("/myapp/api-url")

# Secrets Manager (auto-deserializes JSON)
db_creds = parameters.get_secret("myapp/db-credentials", transform="json")

# AppConfig with custom cache TTL
feature_config = parameters.get_app_config(
    name="features",
    environment="prod",
    application="myapp",
    max_age=300  # cache for 5 minutes
)
Caching is critical for Lambda performance. You could roll your own caching with a module-level variable, but you'd need to manage TTL expiry, handle invalidation, and replicate that logic across every function. Powertools handles all of this automatically - values are cached in memory across warm invocations with a configurable TTL (5 minutes by default in v3), reducing latency and cost with no boilerplate.
Idempotency
The Idempotency utility ensures Lambda functions process each unique request exactly once. It uses DynamoDB to track processed requests by hashing the payload and storing results for a configurable TTL.
from aws_lambda_powertools.utilities.idempotency import (
    DynamoDBPersistenceLayer,
    IdempotencyConfig,
    idempotent,
)

persistence_layer = DynamoDBPersistenceLayer(table_name="IdempotencyTable")
config = IdempotencyConfig(expires_after_seconds=3600)

@idempotent(config=config, persistence_store=persistence_layer)
def lambda_handler(event, context):
    payment = process_payment(event["payment_id"], event["amount"])
    return {"payment_id": payment.id, "status": "completed"}

The flow:
- Request arrives, Powertools hashes the relevant payload fields
- Checks DynamoDB for an existing record with that hash
- If found and not expired, returns the cached result (no re-execution)
- If not found, executes the function and stores the result
- Concurrent requests with the same hash are handled with DynamoDB conditional writes
Key Idempotency Features
- Selective hashing -
event_key_jmespath="body.payment_id"to hash only specific fields - Method-level idempotency -
@idempotent_functionfor individual methods, not just handlers - Custom serialization - Pluggable serializers for complex result types
- Expiry - Configurable TTL for cached results
- Jitter - Built-in jitter to prevent cache stampedes
This is essential for payment processing, order creation, or any operation where double-execution causes real harm.
The idempotency table is a required infrastructure component. In Terraform:
resource "aws_dynamodb_table" "idempotency" {
  name         = "IdempotencyTable"
  billing_mode = "PAY_PER_REQUEST"
  hash_key     = "id"

  attribute {
    name = "id"
    type = "S"
  }

  ttl {
    attribute_name = "expiration"
    enabled        = true
  }
}
PAY_PER_REQUEST avoids capacity planning headaches for bursty workloads, and the TTL attribute lets DynamoDB automatically clean up expired idempotency records.
Batch Processing
The Batch Processing utility handles partial failures for SQS, Kinesis, and DynamoDB Streams. When processing a batch of 10 SQS messages and 2 fail, Powertools reports only those 2 as failed - the other 8 are deleted from the queue.
from aws_lambda_powertools.utilities.batch import (
    BatchProcessor,
    EventType,
    process_partial_response,
)

processor = BatchProcessor(event_type=EventType.SQS)

def record_handler(record):
    payload = record.body
    # Process individual message
    result = process_message(json.loads(payload))
    return result

def lambda_handler(event, context):
    return process_partial_response(
        event=event,
        record_handler=record_handler,
        processor=processor,
        context=context,
    )

Without this utility, a single failed message causes the entire batch to retry - including messages that already processed successfully. This leads to duplicate processing, wasted compute, and potential data corruption.
Key Batch Processing Features
- Partial failures - Only failed records are retried via
batchItemFailuresresponse - Error handling - Configurable error handling strategies (raise, suppress, or custom)
- Async support -
AsyncBatchProcessorfor asyncio-based handlers - Pydantic integration - Combine with Parser for typed record processing
Parser and Validation
The Parser utility uses Pydantic v2 for event validation and transformation. Define models for your event payloads and Powertools validates them automatically:
from pydantic import BaseModel, field_validator
from aws_lambda_powertools.utilities.parser import event_parser

class OrderEvent(BaseModel):
    order_id: str
    customer_id: str
    amount: float
    items: list[str]

    @field_validator("amount")
    @classmethod
    def amount_must_be_positive(cls, v):
        if v <= 0:
            raise ValueError("Amount must be positive")
        return v

@event_parser(model=OrderEvent)
def lambda_handler(event: OrderEvent, context):
    # event is already validated and typed
    logger.info(f"Processing order {event.order_id}")
Built-in envelope support handles the common pattern of extracting business data from AWS event wrappers (API Gateway, SQS, EventBridge, etc.).
Feature Flags and Data Masking
Feature Flags
Feature Flags use AWS AppConfig to evaluate rules at runtime without redeploying:
from aws_lambda_powertools.utilities.feature_flags import FeatureFlags, AppConfigStore

app_config = AppConfigStore(
    environment="prod",
    application="myapp",
    name="features"
)
feature_flags = FeatureFlags(store=app_config)

# Simple boolean flag
premium_enabled = feature_flags.evaluate(name="premium_features", default=False)

# Context-based rules (e.g., percentage rollout, user segments)
new_ui = feature_flags.evaluate(
    name="new_checkout_ui",
    context={"user_id": user_id, "tier": "premium"},
    default=False
)
Data Masking
Data Masking redacts sensitive fields in logs and traces:
from aws_lambda_powertools.utilities.data_masking import DataMasking

masker = DataMasking()
masked = masker.mask(data, fields=["$.credit_card", "$.ssn"])
# credit_card: "*****", ssn: "*****"
Beyond simple field redaction, Data Masking also supports encryption via the AWS Encryption SDK. This lets you encrypt sensitive fields in transit and decrypt them only in authorized downstream services - a step beyond masking for compliance-heavy workloads.
Middleware Factory
The Middleware Factory creates reusable middleware with before/after hooks:
from aws_lambda_powertools.middleware_factory import lambda_handler_decorator

@lambda_handler_decorator
def middleware_with_validation(handler, event, context):
    # Before handler
    if "Authorization" not in event.get("headers", {}):
        return {"statusCode": 401, "body": "Unauthorized"}

    # Execute handler
    response = handler(event, context)

    # After handler
    response["headers"] = {
        **response.get("headers", {}),
        "X-Request-Id": context.aws_request_id
    }
    return response

@middleware_with_validation
def lambda_handler(event, context):
    return {"statusCode": 200, "body": "OK"}
This is useful for cross-cutting concerns like authentication, input validation, response enrichment, and error standardization.
Infrastructure as Code: Terraform
This is how I configure Powertools across 17 Lambda functions in the Smurf ETL project using Terraform:
locals {
  powertools_layer_arn = "arn:aws:lambda:${var.aws_region}:017000801446:layer:AWSLambdaPowertoolsPythonV3-python313-arm64:29"

  # Common Powertools environment variables
  powertools_env_vars = {
    POWERTOOLS_SERVICE_NAME      = "sales-data-platform"
    POWERTOOLS_METRICS_NAMESPACE = "SalesDataPlatform"
    POWERTOOLS_LOG_LEVEL         = var.log_level
  }
}

resource "aws_lambda_function" "process_upload" {
  function_name = "process_upload"
  role          = aws_iam_role.lambda_role.arn
  runtime       = "python3.13"
  architectures = ["arm64"]
  handler       = "process_upload.lambda_handler"
  timeout       = 30
  memory_size   = 256

  reserved_concurrent_executions = 10  # prevent runaway scaling

  layers = [local.powertools_layer_arn]

  tracing_config {
    mode = "Active"
  }

  environment {
    variables = merge(local.powertools_env_vars, {
      S3_BUCKET        = aws_s3_bucket.upload_bucket.id
      PROCESSED_PREFIX = var.processed_prefix
    })
  }
}

# Explicit log group with retention - don't pay for infinite retention
resource "aws_cloudwatch_log_group" "process_upload" {
  name              = "/aws/lambda/process_upload"
  retention_in_days = 30
}
IAM for Powertools Utilities
Each Powertools utility has specific IAM requirements. A least-privilege role scoped to what the function actually needs looks like this:
resource "aws_iam_role" "lambda_role" {
  name               = "process-upload-role"
  assume_role_policy = data.aws_iam_policy_document.lambda_assume.json
}

data "aws_iam_policy_document" "lambda_assume" {
  statement {
    actions = ["sts:AssumeRole"]
    principals {
      type        = "Service"
      identifiers = ["lambda.amazonaws.com"]
    }
  }
}

resource "aws_iam_role_policy" "powertools_permissions" {
  name   = "powertools-permissions"
  role   = aws_iam_role.lambda_role.id
  policy = data.aws_iam_policy_document.powertools.json
}

data "aws_caller_identity" "current" {}

data "aws_iam_policy_document" "powertools" {
  # Note: This policy covers Powertools-specific permissions only.
  # Your function will also need permissions for its business logic
  # (S3, DynamoDB, Bedrock, etc.).
  # CloudWatch Logs - required for Logger
  statement {
    actions   = ["logs:CreateLogStream", "logs:PutLogEvents"]
    resources = ["${aws_cloudwatch_log_group.process_upload.arn}:*"]
  }

  # X-Ray - required for Tracer
  statement {
    actions   = ["xray:PutTraceSegments", "xray:PutTelemetryRecords"]
    resources = ["*"]
  }

  # SSM Parameter Store - required for Parameters utility
  statement {
    actions   = ["ssm:GetParameter", "ssm:GetParametersByPath"]
    resources = ["arn:aws:ssm:${var.aws_region}:${data.aws_caller_identity.current.account_id}:parameter/myapp/*"]
  }

  # DynamoDB - required for Idempotency utility
  statement {
    actions   = ["dynamodb:GetItem", "dynamodb:PutItem", "dynamodb:UpdateItem", "dynamodb:DeleteItem"]
    resources = [aws_dynamodb_table.idempotency.arn]
  }
}
Key patterns:
- Layer ARN in a local - Change the version once, all functions update
merge()for env vars - Common Powertools vars merged with function-specific varstracing_config { mode = "Active" }- Enables X-Ray for the Tracer utility- ARM64 architecture - Graviton gives better price-performance, and Powertools provides ARM64-specific layers
- Explicit timeout and memory - Don't rely on defaults (3s/128MB); Powertools Tracer adds some overhead, so size accordingly
- Reserved concurrency - Prevents runaway scaling from overwhelming downstream services like DynamoDB or external APIs
- Explicit log group with retention - Don't pay for infinite retention; 30 days covers most debugging needs
- Least-privilege IAM - Each Powertools utility gets only the permissions it needs, scoped to specific resource ARNs where possible
Infrastructure as Code: SAM
From the Account Watcher project, using SAM with Powertools:
Globals:
  Function:
    Timeout: 3
    MemorySize: 128
    Tracing: Active
    LoggingConfig:
      LogFormat: JSON
    Environment:
      Variables:
        POWERTOOLS_SERVICE_NAME: AccountEventHandler

Resources:
  AccountEventHandler:
    Type: AWS::Serverless::Function
    Properties:
      CodeUri: account_event_handler/
      Handler: app.lambda_handler
      Runtime: python3.12
      Architectures:
        - arm64
      Layers:
        - !Sub arn:aws:lambda:${AWS::Region}:017000801446:layer:AWSLambdaPowertoolsPythonV2-Arm64:69
SAM's Globals section is powerful here - Tracing: Active and LoggingConfig apply to all functions in the template. The layer ARN uses !Sub for region substitution.
Warning: This project still uses the v2 layer, which reached end of support on March 25, 2025. Don't copy this ARN into new projects. For v3, replace the layer with:
arn:aws:lambda:{region}:017000801446:layer:AWSLambdaPowertoolsPythonV3-python313-arm64:29
The migration is straightforward - update the layer ARN, bump the runtime, and fix any deprecated imports. The core decorator pattern (@logger.inject_lambda_context, @tracer.capture_lambda_handler, @metrics.log_metrics) is identical between v2 and v3.
CDK users: Powertools is equally well-supported with AWS CDK. The aws-lambda-python-alpha construct handles bundling, and you can pass the Powertools layer ARN via LayerVersion.fromLayerVersionArn(). The same environment variables and layer patterns apply - just expressed as CDK constructs instead of HCL or YAML.
Real Architecture: Smurf ETL Pipeline
My Serverless Smurf ETL and Analytics project is a sales data platform with 17 Lambda functions - every one using Powertools.

The pipeline:
- Store managers upload daily sales JSON via a presigned URL
- EventBridge triggers the process-upload function (JSON validation, Parquet conversion)
- Step Functions orchestrates the daily analysis pipeline
- Lambda functions calculate store metrics, company metrics, and product metrics
- Three Bedrock-powered functions detect anomalies, analyze trends, and generate recommendations
- Results are stored in DynamoDB and exported to QuickSight
- A React frontend displays analytics via CloudFront
Every Lambda function uses the same three-decorator pattern:
@logger.inject_lambda_context(log_event=True)
@tracer.capture_lambda_handler
@metrics.log_metrics(capture_cold_start_metric=True)
def lambda_handler(event, context: LambdaContext):
The Terraform configuration uses merge(local.powertools_env_vars, {...}) to ensure consistent service names and namespaces across all 17 functions. CloudWatch Logs Insights queries work seamlessly across all functions because the log format is identical.
Real Architecture: Account Watcher
My Serverless Account Watcher monitors AWS account changes and sends notifications via Slack and email.

The architecture:
- CloudTrail captures all API activity in the AWS account
- EventBridge rules match specific events (S3 bucket deletion, IAM key creation, root login)
- A Lambda function processes matched events, formats messages, and sends notifications
- Slack webhook for instant alerts, SNS for email distribution
The Lambda function uses all three Powertools decorators plus @tracer.capture_method on helper functions:
@tracer.capture_lambda_handler
@logger.inject_lambda_context(log_event=True)
@metrics.log_metrics(capture_cold_start_metric=True)
def lambda_handler(event, context):
    event_name, event_detail = parse_event(event)
    send_slack_message({"text": f"{event_name}: {event_detail}"}, SLACK_WEBHOOK_URL)
    publish_to_sns(event_name, event_detail, SNS_TOPIC_ARN)
This is a great starter project for anyone learning Powertools - it's a single Lambda function with real-world observability, and you can deploy it with sam deploy in minutes.
Best Practices and Patterns
After using Powertools across multiple production projects, here are the practices I've found most valuable:
- Always use all three core decorators. Logger, Tracer, and Metrics together provide comprehensive observability. The overhead is negligible compared to the debugging value.
- Set
POWERTOOLS_SERVICE_NAMEconsistently. Use the same service name across related functions. This is the primary filter key in CloudWatch Logs Insights and X-Ray. - Use
log_event=Truein non-production only. Logging the full event is invaluable for debugging but can expose PII, payment data, or health information in production - potentially violating GDPR, PCI-DSS, or HIPAA. Omitlog_eventin production (it defaults toFalse), and use an environment variable to enable it per stage. For events that do contain sensitive fields, pair this with the Data Masking utility to redact or encrypt before logging. - Prefer layers over pip install. Layers reduce deployment package size and ensure all functions use the same Powertools version. Update the layer version in one place (Terraform local or SAM Globals).
- Use
merge()in Terraform for environment variables. Define common Powertools vars once in a local block, then merge with function-specific vars. This prevents drift. - Add custom dimensions to metrics. Default metrics are useful but dimensions like
ModelId,StoreId, orEnvironmentmake metrics actionable. - Use
@tracer.capture_methodon important helper functions. Not every function needs tracing, but external calls (APIs, databases, S3) should always be traced. - Adopt idempotency for payment and write operations. The cost of a DynamoDB lookup is trivial compared to the cost of double-processing a payment.
- Use batch processing for SQS consumers. Partial failure reporting prevents the "poison message" problem where one bad record blocks the entire queue.
- Keep the layer version pinned. Use a specific version number, not
latest. Update deliberately after testing.
Powertools Timeline
Powertools for Python has had an active release cadence since the v3.0 GA launch. Here are the key milestones in reverse chronological order:
- March 2026 - v3.25.0 released. An RFC is also in progress for native OpenTelemetry support in the Tracer utility. When shipped, Tracer will support any OTLP-compatible backend (Datadog, Honeycomb, Grafana) without changing application code.
- February 2026 - The AWS X-Ray SDK entered maintenance mode on February 25, 2026. AWS recommends migrating to ADOT (AWS Distro for OpenTelemetry) or native OpenTelemetry instrumentation. For Lambda functions, Powertools Tracer remains a strong option that abstracts the underlying SDK - and with the OTel RFC in progress, Powertools itself will eventually move to an OTel backend.
- January 2026 - v3.24.0 released. Python 3.9 was dropped. Supported versions: 3.10, 3.11, 3.12, 3.13, 3.14.
- November 2025 - v3.23.0 added Python 3.14 Lambda runtime support.
- October 2025 - v3.21-3.22 brought Pydantic model support for query string and header parameter validation in Event Handler, plus enhanced OpenAPI response capabilities (headers, links, examples, encoding).
- June 2025 - v3.14-3.15 introduced the BedrockAgentFunctionResolver for building Bedrock Agent integrations with Lambda, and the Kafka Consumer utility with automatic JSON, Avro, and Protocol Buffer deserialization.
- April 2025 - v3.11 launched the AppSync Events Resolver for handling real-time APIs, plus Data Masking support for Pydantic models, dataclasses, and standard Python classes.
- March 2025 - v2 reached end of support on March 25, 2025. Migration to v3 is straightforward - update the layer ARN and fix deprecated imports. The core decorator patterns are identical.
Common Pitfalls and Tips
- Forgetting
@metrics.log_metrics- Without this decorator, metrics are never flushed. Youradd_metriccalls silently do nothing. Always decorate the handler. - Oversized log events -
log_event=Truewith large payloads (S3 batch notifications, SQS batch of 10,000 records) can exceed CloudWatch log size limits. Uselog_event=Trueselectively. - Tracer in non-Lambda contexts - The Tracer utility assumes X-Ray is available. In unit tests, set
POWERTOOLS_TRACE_DISABLED=trueto avoid errors. - Idempotency table capacity - For high-throughput functions, use on-demand capacity for the idempotency DynamoDB table. Provisioned capacity can throttle under burst.
- Layer version mismatch - Mixing Powertools layer versions across functions in the same service causes inconsistent log formats and metric namespaces. Pin to one version.
- Cold start metrics confusion - The
ColdStartmetric counts cold starts, not warm starts. A spike means your functions are scaling up or being recycled. - Missing
tracing_config { mode = "Active" }- The Tracer decorator works without active tracing, but traces will not appear in X-Ray. Always enable active tracing in your IaC.
Resources
- Powertools for AWS Lambda (Python) Documentation
- Powertools GitHub Repository
- Smurf ETL and Analytics - 17 Lambda functions with Powertools
- Serverless Account Watcher - EventBridge + Powertools monitoring
- Smurf ETL GitHub Repo - Full Terraform and Python code
- Account Watcher GitHub Repo - SAM template and Lambda code
- AWS X-Ray SDK Maintenance Mode Announcement
- CloudWatch Embedded Metric Format Specification
- AWS London Ontario User Group - Community meetups and talks
- AWS London Ontario User Group YouTube - Recorded presentations
Connect with me on X, Bluesky, LinkedIn, GitHub, Medium, Dev.to, or the AWS Community. Check out more of my projects at darryl-ruggles.cloud and join the Believe In Serverless community.
Comments
Loading comments...