AWS Lambda Now Knows Where It Lives: Exploring the New AZ Metadata
Lambda was the last holdout. EC2 has had its Instance Metadata Service since the beginning. ECS and Fargate have their task metadata endpoints. But Lambda? If your function needed to know which Availability Zone it was running in, you were out of luck - unless you enjoyed building elaborate workarounds with private API Gateway endpoints and DescribeNetworkInterfaces calls.
On March 19, 2026, AWS quietly fixed this with a new metadata endpoint that exposes the AZ ID of the execution environment. No VPC is required, no IAM permissions are needed, and there are no API calls to external services. It's just a localhost HTTP endpoint that returns your AZ in under a millisecond.
I built a small demo app to explore three practical uses for this new metadata, using Powertools for AWS Lambda for observability throughout (I wrote about Powertools best practices previously). The code is on GitHub if you want to deploy it yourself.
What's in the Box
Lambda now sets two new reserved environment variables in every execution environment:
| Variable | Description |
|---|---|
AWS_LAMBDA_METADATA_API | Address of the metadata server (e.g., 169.254.100.1:9001) |
AWS_LAMBDA_METADATA_TOKEN | Auth token unique to this execution environment |
You make a GET request to the endpoint with the token as a Bearer header, and you get back your AZ ID:
GET http://${AWS_LAMBDA_METADATA_API}/2026-01-15/metadata/execution-environment
Authorization: Bearer ${AWS_LAMBDA_METADATA_TOKEN}

{
  "AvailabilityZoneID": "use1-az1"
}
That's it. The response is cached for 12 hours and marked immutable - it never changes within an execution environment.
Powertools for AWS Lambda makes it even simpler:
from aws_lambda_powertools.utilities.metadata import get_lambda_metadata

metadata = get_lambda_metadata()
az_id = metadata.availability_zone_id  # "use1-az1"
Powertools handles the caching and SnapStart invalidation automatically.
AZ IDs vs AZ Names
One important detail: the metadata returns AZ IDs (use1-az1), not AZ names (us-east-1a). This matters because AZ IDs are consistent across all AWS accounts - use1-az1 is always the same physical data center regardless of which account you're in. AZ names are mapped differently per account to distribute load, so my us-east-1a might be a completely different physical zone than yours.
If you need the AZ name for your account, you can resolve it with a single EC2 API call:
ec2 = boto3.client("ec2")
resp = ec2.describe_availability_zones(
    Filters=[{"Name": "zone-id", "Values": ["use1-az1"]}]
)
az_name = resp["AvailabilityZones"][0]["ZoneName"]  # "us-east-1a"
Cache this - it does not change.
The Demo App
I built a single Lambda function with three API routes using Powertools Event Handler, deployed with SAM. Each route demonstrates a different use case for the new AZ metadata.
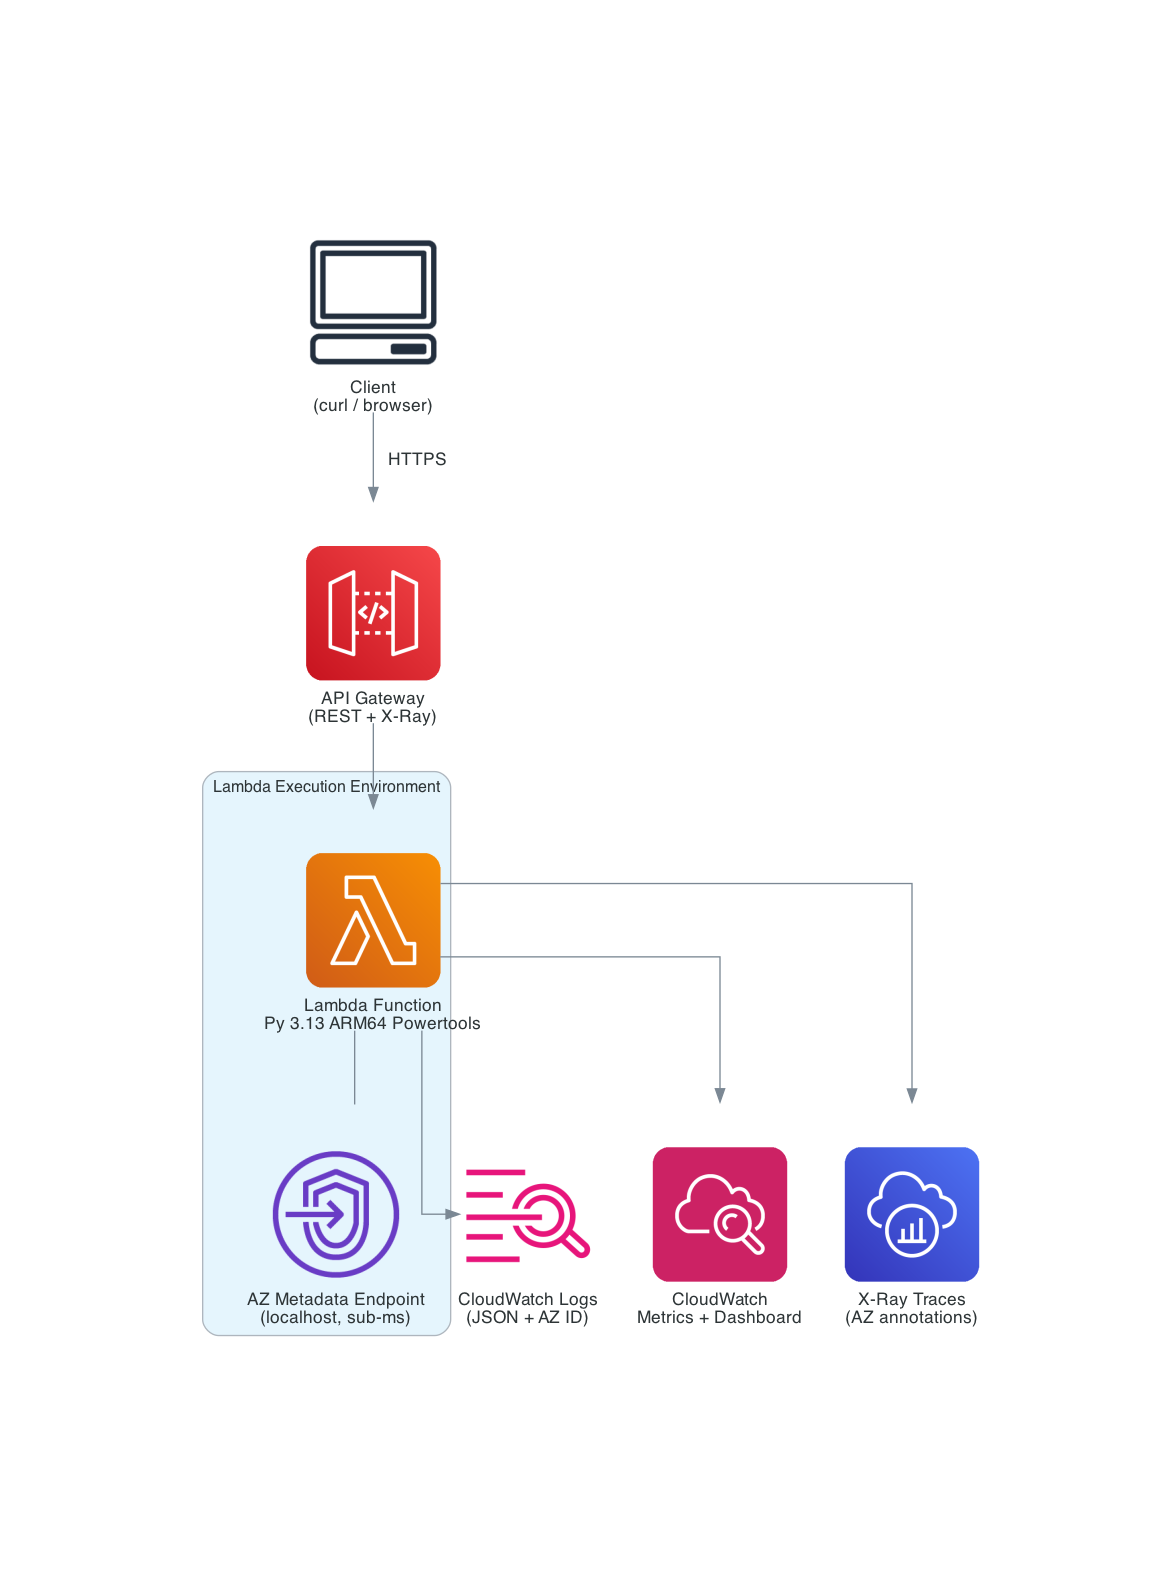
| Service | Purpose |
|---|---|
| API Gateway | REST API with X-Ray tracing |
| Lambda (Python 3.13, ARM64) | Single function, 3 routes via Powertools Event Handler |
| Powertools Layer | Logger, Tracer, Metrics, Event Handler, Lambda Metadata |
| CloudWatch Dashboard | Invocations, cold starts, routing, and chaos metrics by AZ |
The Foundation: AZ-Enriched Observability
Before getting to the three routes, the most important pattern is in the module initialization and handler. I resolve the AZ ID once during cold start and set it as a default metric dimension:
from aws_lambda_powertools import Logger, Metrics, Tracer
from aws_lambda_powertools.event_handler import APIGatewayRestResolver

logger = Logger()
tracer = Tracer()
metrics = Metrics()
app = APIGatewayRestResolver()

# Resolve AZ ID at module level - metadata endpoint is localhost, sub-millisecond
AZ_ID = _init_az_id()

# Every custom metric gets the AZ dimension automatically
if AZ_ID != "unknown":
    metrics.set_default_dimensions(AvailabilityZoneID=AZ_ID)
Then in the handler, following the Powertools three-decorator pattern, I inject the AZ ID into every log line and X-Ray trace:
@logger.inject_lambda_context(log_event=True)
@tracer.capture_lambda_handler
@metrics.log_metrics(capture_cold_start_metric=True)
def lambda_handler(event: dict, context: LambdaContext) -> dict:
    logger.append_keys(availability_zone_id=AZ_ID)
    tracer.put_annotation("availability_zone_id", AZ_ID)
    return app.resolve(event, context)
Now every log line from this function includes the AZ:
{
    "level": "INFO",
    "message": "Routing decision",
    "availability_zone_id": "use1-az4",
    "endpoint": "cache-az4.internal:6379",
    "same_az": true,
    "service": "lambda-metadata-explorer"
}
During an AZ incident, you can filter to the affected zone instantly in CloudWatch Logs Insights:
fields @timestamp, availability_zone_id, message, level
| filter availability_zone_id = "use1-az4"
| filter level = "ERROR"
| sort @timestamp desc
The tracer.put_annotation call adds the AZ ID as an X-Ray annotation on every trace. You can filter traces by AZ in the X-Ray console using:
annotation.availability_zone_id = "use1-az4"
This lets you isolate all traces from a specific AZ during an incident. Click any trace segment and check the Annotations tab to see the AZ ID.
This alone is worth the feature. Before March 19, you simply could not do this with Lambda.
Use Case 1: Exploring the Metadata (GET /metadata)
The first route is straightforward - it returns the AZ metadata from both the Powertools utility and the raw HTTP endpoint, plus the resolved AZ name. This is mostly educational, showing developers both access methods side by side:
@app.get("/metadata")
@tracer.capture_method
def explore_metadata():
    az_name = _resolve_az_name()  # EC2 API call, cached after first use
    metrics.add_metric(name="MetadataRequests", unit=MetricUnit.Count, value=1)

    return {
        "availability_zone": {
            "az_id": AZ_ID,
            "az_name": az_name,
        },
        "execution_context": {
            "function_name": os.environ.get("AWS_LAMBDA_FUNCTION_NAME", "local"),
            "region": os.environ.get("AWS_REGION", "unknown"),
            "memory_mb": os.environ.get("AWS_LAMBDA_FUNCTION_MEMORY_SIZE", "unknown"),
        },
    }
Seeing the Multi-AZ Distribution
There's a subtlety here. If you call the endpoint 20 times sequentially, you'll likely see the same AZ every time. That's because Lambda reuses warm execution environments, and a warm instance stays in the same AZ for its lifetime.
To actually see Lambda's multi-AZ distribution, you need to force it to spin up multiple execution environments simultaneously. The included test script fires 60 concurrent requests using xargs -P, which overwhelms a single warm instance and forces Lambda to create new environments across different AZs:
# 60 total requests, 20 concurrent at a time
./scripts/test_az_distribution.sh $API_URL 20 60
--- AZ Distribution ---

Count  AZ ID          AZ Name
-----  -------------- -------
22     use1-az4       us-east-1d
20     use1-az1       us-east-1a
18     use1-az6       us-east-1f

Unique AZs observed: 3
Total responses:     60
Lambda spreads execution environments across multiple AZs for resilience. Now you can actually see it happening, and with the AZ-enriched CloudWatch dashboard, you can monitor this distribution in real time.
This is also why the chaos engineering use case (Use Case 3) needs concurrent traffic. If you only have one warm instance, targeting a specific AZ is hit-or-miss. With concurrent load, you'll have instances spread across AZs, and the ones in the target AZ will return 503 while the others continue serving normally - exactly how a real AZ outage would behave.
Use Case 2: Same-AZ Routing (POST /route)
This is the use case with the most immediate dollar impact. Cross-AZ data transfer costs $0.01/GB in each direction. If you have a Lambda function making thousands of calls per second to an ElastiCache cluster or RDS read replica, and it's routing to whatever endpoint it gets, you're paying for cross-AZ traffic on roughly two-thirds of those calls (assuming 3 AZs).
With the AZ metadata, you can route to the same-AZ endpoint:
@app.post("/route")
@tracer.capture_method
def route_request():
    body = app.current_event.json_body or {}

    # In production, load from SSM Parameter Store or service discovery
    endpoint_map = json.loads(os.environ.get("AZ_ENDPOINT_MAP", "{}")) or {
        "use1-az1": "cache-az1.internal:6379",
        "use1-az2": "cache-az2.internal:6379",
        "use1-az4": "cache-az4.internal:6379",
        "use1-az6": "cache-az6.internal:6379",
    }
    fallback = os.environ.get("FALLBACK_ENDPOINT", "cache-primary.internal:6379")

    selected = endpoint_map.get(AZ_ID, fallback)
    same_az = AZ_ID in endpoint_map

    metrics.add_metric(name="RoutingDecisions", unit=MetricUnit.Count, value=1)
    tracer.put_annotation("routing_type", "same-az" if same_az else "cross-az")

    return {
        "az_id": AZ_ID,
        "routing": {"selected_endpoint": selected, "same_az": same_az},
        "cost_insight": {
            "cross_az_cost_per_gb": "$0.01 per direction ($0.02 round-trip)",
            "same_az_cost_per_gb": "$0.00",
        },
    }
The endpoint map is a simple AZ-ID-to-endpoint mapping. In production, you'd load this from SSM Parameter Store using the Powertools Parameters utility with caching:
from aws_lambda_powertools.utilities import parameters

endpoint_map = parameters.get_parameter("/myapp/az-endpoint-map", transform="json")
For an ElastiCache cluster, you'd use the node endpoints for each AZ. For RDS with read replicas, you'd map to the replica in each AZ. The key insight is that you now know which AZ you're in and can make an informed routing decision.
Cost math: At 1 TB/month of data transfer with 3 AZs, roughly 67% crosses AZ boundaries. AWS charges $0.01/GB in each direction, so cross-AZ round-trips cost $0.02/GB effectively. That's ~$13.40/month in cross-AZ charges for this example. With same-AZ routing, it drops to near zero. The savings scale linearly with traffic volume.
Use Case 3: AZ-Aware Chaos Engineering (POST /chaos)
The third route is about resilience testing. You specify a target AZ, and if the function happens to be running there, it injects a failure. This lets you test how your upstream systems - load balancers, retry logic, circuit breakers - handle an AZ going unhealthy.
@app.post("/chaos")
@tracer.capture_method
def chaos_test():
    body = app.current_event.json_body or {}
    target_az = body.get("target_az", "")
    failure_mode = body.get("failure_mode", "error")

    if target_az and AZ_ID == target_az:
        metrics.add_metric(name="ChaosFailuresInjected", unit=MetricUnit.Count, value=1)
        logger.warning("Chaos: injecting failure", extra={
            "target_az": target_az,
            "failure_mode": failure_mode,
        })

        if failure_mode == "latency":
            time.sleep(min(body.get("delay_seconds", 3), 10))
            return {"az_id": AZ_ID, "chaos": {"triggered": True, "mode": "latency"}}

        raise ServiceError(503, f"Simulated AZ failure in {AZ_ID}")

    return {"az_id": AZ_ID, "chaos": {"triggered": False, "target_az": target_az}}
Two failure modes:
error- Returns HTTP 503. Tests whether callers retry and eventually hit a healthy AZ.latency- Injects a delay (capped at 10 seconds). Tests whether callers have appropriate timeouts and circuit breakers.
In a real project, you'd combine this with an ALB or API Gateway with health checks. Target a specific AZ and observe whether traffic shifts to healthy AZs. The CloudWatch dashboard shows failures concentrated in the target AZ while other AZs continue serving normally - exactly what you'd see during a real AZ impairment.
One important detail for testing: make test-chaos auto-detects your current warm instance's AZ and targets it, guaranteeing a triggered failure. But for a more realistic simulation, fire concurrent traffic while targeting a specific AZ - some requests will fail (those in the target AZ) while others succeed (those in healthy AZs).
Before this feature, you'd need to deploy different code per AZ or use external feature flags combined with some mechanism to map invocations to AZs. Now it's a simple string comparison.
The SAM Template
The deployment is a straightforward SAM template - one function, one API, one CloudWatch dashboard:
Globals:
  Function:
    Runtime: python3.13
    Architectures:
      - arm64
    Timeout: 30
    MemorySize: 256
    Tracing: Active
    LoggingConfig:
      LogFormat: JSON

Resources:
  AZMetadataFunction:
    Type: AWS::Serverless::Function
    Properties:
      FunctionName: !Sub lambda-metadata-explorer-${Environment}
      CodeUri: src/
      Handler: app.lambda_handler
      Layers:
        - !Sub arn:aws:lambda:${AWS::Region}:017000801446:layer:AWSLambdaPowertoolsPythonV3-python313-arm64:${PowertoolsLayerVersion}
      Environment:
        Variables:
          POWERTOOLS_SERVICE_NAME: lambda-metadata-explorer
          POWERTOOLS_METRICS_NAMESPACE: AZMetadataExplorer
          POWERTOOLS_LOG_LEVEL: !Ref LogLevel
          POWERTOOLS_TRACER_CAPTURE_RESPONSE: 'true'
          POWERTOOLS_TRACER_CAPTURE_ERROR: 'true'
      Policies:
        - Statement:
            - Effect: Allow
              Action:
                - ec2:DescribeAvailabilityZones
              Resource: '*'
      Events:
        GetMetadata:
          Type: Api
          Properties:
            Path: /metadata
            Method: get
        PostRoute:
          Type: Api
          Properties:
            Path: /route
            Method: post
        PostChaos:
          Type: Api
          Properties:
            Path: /chaos
            Method: post
ARM64 (Graviton) for better price-performance. Powertools via the AWS-managed Lambda Layer (plus pip bundling from requirements.txt to ensure v3.26.0+ with the metadata utility is available even if the Layer hasn't been updated yet). X-Ray tracing active. JSON log format. The only extra IAM permission is ec2:DescribeAvailabilityZones for the AZ name resolution - the metadata endpoint itself requires no permissions.
The template also creates a CloudWatch dashboard with AZ distribution widgets. The AZ dimension comes from metrics.set_default_dimensions(AvailabilityZoneID=AZ_ID) which tags every custom metric with the availability zone. The dashboard references explicit metric definitions for each AZ:
["AZMetadataExplorer", "MetadataRequests", "AvailabilityZoneID", "use1-az1", "service", "lambda-metadata-explorer"]
One gotcha: the ColdStart metric uses Powertools' built-in dimensions (function_name + service) rather than our custom AZ dimension, because Powertools captures it before the handler runs. So the Cold Starts widget shows a total count rather than a per-AZ breakdown.
Deploy and Try It
Prerequisites: AWS CLI, SAM CLI, Python 3.13+, an AWS account.
git clone https://github.com/RDarrylR/lambda-az-metadata.git
cd lambda-az-metadata

# Build and deploy
sam build --profile your-profile --region us-east-1
sam deploy --guided --profile your-profile --region us-east-1

# Or use the Makefile
make deploy PROFILE=your-profile
After deploying, grab the API URL from the stack outputs and explore:
# See your AZ metadata
curl -s $API_URL/metadata | python3 -m json.tool

# Test same-AZ routing
curl -s -X POST $API_URL/route \
  -H "Content-Type: application/json" \
  -d '{"message": "hello"}' | python3 -m json.tool

# Test chaos engineering (replace use1-az1 with an AZ from your /metadata response)
curl -s -X POST $API_URL/chaos \
  -H "Content-Type: application/json" \
  -d '{"target_az": "use1-az1", "failure_mode": "error"}' | python3 -m json.tool

# See the AZ distribution across 60 concurrent invocations
make test-distribution
Cleanup:
sam delete --stack-name lambda-az-metadata --profile your-profile --region us-east-1
What It Costs
This demo runs well within the AWS free tier. Lambda gives you 1M requests/month and 400K GB-seconds. API Gateway gives you 1M calls for the first 12 months. The metadata endpoint itself is free - no additional charges.
Gotchas
A few things to watch for:
- Region-specific AZ IDs. The demo code and dashboard use
us-east-1AZ IDs (use1-az1throughuse1-az6). If you deploy to a different region, update the default endpoint map inapp.pyand the dashboard metrics intemplate.yamlwith your region's AZ IDs (e.g.,usw2-az1forus-west-2). - Caching is your friend. The metadata response is
immutablewithin an execution environment. Resolve it once at module level and forget about it. There is no reason to call the endpoint on every invocation. - VPC doesn't matter. The metadata endpoint is localhost inside the execution environment - it works identically with or without a VPC. No VPC endpoints, NAT gateways, or security group rules needed.
- SnapStart changes things. If you use SnapStart, the execution environment might move to a different AZ after restore. The metadata endpoint cooperates with SnapStart by reducing the cache TTL during initialization, so Powertools can detect the need to re-fetch after restore and handles this automatically. But this demo resolves
AZ_IDat module level during init - that code runs during the snapshot phase. After restore, the cached module-level variable could be wrong. For SnapStart, move the AZ resolution into the handler or use a@register_checkpoint_restorehook to re-resolve after restore. - The response may grow. The documentation says additional fields may be added in future updates. Don't fail on unknown fields.
log_event=TrueandCAPTURE_RESPONSEin production. I use both here for debugging visibility, but in production, disable them if your payloads contain sensitive data.log_event=Truelogs full request bodies to CloudWatch, andPOWERTOOLS_TRACER_CAPTURE_RESPONSEstores full response bodies as X-Ray metadata. Control both via environment variables without code changes.- Layer version. The
get_lambda_metadata()utility requires Powertools v3.26.0+ (Lambda Layer version 30+, released March 20, 2026). The SAM template defaults to version 30. Check the layer version history for the latest. - Import path. As of v3.26.0, the working import path is
from aws_lambda_powertools.utilities.metadata import get_lambda_metadata. The Lambda documentation currently showsutilities.lambda_metadata, which may be corrected in a future docs update. Verify against your installed version if in doubt.
What's Next
The metadata endpoint currently returns only AvailabilityZoneID, but the versioned API path (/2026-01-15/) and the documentation's note about future fields suggest more is coming. Execution environment ID? Host-level metadata? We'll see.
For now, the AZ ID alone unlocks meaningful improvements in observability, cost optimization, and resilience testing. It's one of those features that's so obviously useful, you wonder why it took this long.
The code is on GitHub. Clone it, deploy it, and check your CloudWatch dashboard to see which AZs your Lambda functions are actually running in.
Resources
- AWS Announcement: Lambda Availability Zone Metadata
- Lambda Metadata Endpoint Documentation
- Powertools for AWS Lambda (Python)
- Powertools Lambda Metadata Utility
- Powertools Layer Versions
- Advanced Multi-AZ Resilience Patterns (Whitepaper)
- AWS Lambda Resilience Under the Hood
Connect with me on X, Bluesky, LinkedIn, GitHub, Medium, Dev.to, or the AWS Community. Check out more of my projects at darryl-ruggles.cloud and join the Believe In Serverless community.
Comments
Loading comments...