Kubectl Commands I Actually Use Every Day: A Practical Guide to Kubernetes Debugging and Operations
Kubectl is the one tool I reach for first every single time I work with Kubernetes. Not Lens, not K9s, not a dashboard - kubectl. It is the fastest path from "something is wrong" to "I know exactly what is wrong," and once you learn the commands that matter, you will wonder how you ever worked without them.
This is not a comprehensive reference. The Kubernetes documentation already does that well. This is the set of commands I use week after week in real clusters - the ones that actually solve problems. I have organized them as a workflow: assess, investigate, interact, and resolve.
How kubectl Talks to Your Cluster
Before diving into commands, it helps to have a mental model of what happens when you hit enter. Kubectl is not doing anything magical - it reads your ~/.kube/config to figure out which cluster to talk to, constructs an HTTP request, and sends it to the API server. That is it. Whether you run get pods or delete deployment, you are making REST calls. This matters because when kubectl feels slow or times out, you now know to check your network path to the API server rather than blaming kubectl itself.

The very first thing I do on any new machine, VM, or container where I will be running kubectl is add this to my shell profile:
alias k='kubectl'
Seven characters down to one. It sounds trivial, but over years of typing kubectl hundreds of times a day, this alias has saved me thousands - possibly millions - of keystrokes. Every example in this post uses the full kubectl command for clarity, but in practice I am always typing k get pods, k logs, k describe. If you take only one thing from this entire article, let it be this alias.
The second thing I set up is tab completion - and there is a catch when you use the k alias. By default, kubectl's shell completion only works for the full kubectl command. You need to explicitly wire it up for your alias too, or you lose autocompletion for resource names, namespaces, and flags. Here is the full setup for both bash and zsh:
Bash (add to ~/.bashrc):
source <(kubectl completion bash)
alias k='kubectl'
complete -o default -F __start_kubectl k
Zsh (add to ~/.zshrc):
source <(kubectl completion zsh)
alias k='kubectl'
compdef k=kubectl
That last line in each block is the one most guides skip. Without it, you can type k get po and hit tab, and nothing happens. With it, you get full autocompletion on resource types, pod names, namespaces, flags - everything. It is a small setup step that makes a massive difference in daily use.
The syntax is consistent: kubectl [command] [TYPE] [NAME] [flags]. Once this pattern clicks, every new command feels familiar. A few shortcuts worth memorizing right away:
| Resource | Shorthand |
|---|---|
| pods | po |
| services | svc |
| deployments | deploy |
| namespaces | ns |
| configmaps | cm |
| ingresses | ing |
| replicasets | rs |
| statefulsets | sts |
| daemonsets | ds |
These save real time when you are typing dozens of commands during an incident.
Step 1: Assess - What Is the Current State?
Every debugging session starts with the same question: what is happening right now? These commands answer that.
kubectl get - The Starting Point
# List pods in the current namespace with extra detail
kubectl get pods -o wide

# List pods across ALL namespaces - your first move during an incident
# Note: -A requires cluster-wide list permissions (see RBAC note below)
kubectl get pods -A

# Watch pods in real time (great during deployments)
kubectl get pods -w

# Sort by restart count to find the troublemakers
kubectl get pods --sort-by='.status.containerStatuses[0].restartCount'

# Filter by label - find all pods belonging to a specific app
kubectl get pods -l app=api-gateway

# Get everything in a namespace at once
kubectl get all -n production
The -o wide flag is one I use on almost every get command. It adds the node name, IP address, and nominated node - information that is essential when you suspect a node-level issue.
A note on RBAC: In a well-governed cluster, most engineers will have RBAC scoped to their team's namespaces - not cluster-wide access. Commands like kubectl get pods -A require a ClusterRole with list permissions across all namespaces, which you may not have. If -A returns a forbidden error, scope your commands to the namespaces you own with -n <namespace> instead. Use kubectl auth can-i list pods --all-namespaces to check before you hit the wall.
kubectl get events - The Timeline
Events are the first thing I check when something goes wrong. They tell you what happened in chronological order.
# Recent events sorted by time - the single most useful debugging command
kubectl get events --sort-by='.lastTimestamp' -n production

# Watch events as they happen (great during rollouts)
kubectl get events -w

# Filter events for a specific pod
kubectl get events --field-selector involvedObject.name=api-pod-7d4f8b --sort-by='.lastTimestamp'
I have lost count of the number of times an event has told me exactly what went wrong before I even looked at logs. A pod stuck in Pending? Events will show you the scheduler could not find a node. An image that will not pull? Events will show the exact registry error. If you only add one command to your workflow, make it this one.
kubectl top - Resource Consumption at a Glance
# Which nodes are running hot?
kubectl top nodes

# Which pods are consuming the most CPU?
kubectl top pods --sort-by=cpu -A

# Memory consumption for a specific namespace
kubectl top pods -n production --sort-by=memory

# Container-level breakdown within pods
kubectl top pods --containers -n production
kubectl top requires the Metrics Server to be installed. It is not deployed by default on EKS - you need to install it yourself, either as a community add-on through the EKS console or API, or via the upstream manifest:
kubectl apply -f https://github.com/kubernetes-sigs/metrics-server/releases/latest/download/components.yaml
AWS now recommends the add-on approach, and the manifest method is heading toward deprecation. One exception: EKS Auto Mode clusters include Metrics Server out of the box.
If you are running Fargate nodes, note that port 10250 is reserved by Fargate. You must configure Metrics Server to listen on a different port (typically 10251). The EKS add-on version handles this automatically, but manual manifest deployments will fail on Fargate without this change.
ktop - A Better Top for Kubernetes
kubectl top gives you a snapshot, but if you want a live, continuously updating view of your cluster - think htop for Kubernetes - install ktop. I keep it running in a terminal pane whenever I am working with a cluster.
# Install via krew (the kubectl plugin manager - https://krew.sigs.k8s.io)
kubectl krew install ktop

# Launch it
kubectl ktop
It shows nodes, pods, and containers with CPU and memory metrics that refresh in real time, and you can navigate through them interactively. It works with Prometheus for richer metrics, falls back to Metrics Server, and if neither is available it will show resource requests and limits instead. Much more useful than running kubectl top repeatedly.
Step 2: Investigate - Dig Into the Details
Once you know which resource has a problem, these commands tell you why.
kubectl describe - The Full Story
# Describe a specific pod - check Events section at the bottom first
kubectl describe pod api-pod-7d4f8b -n production

# Describe a node to check conditions, capacity, and allocated resources
kubectl describe node ip-10-0-1-47.ec2.internal

# Describe a service to verify selectors and endpoints
kubectl describe svc api-gateway -n production
When I read describe output, I skip straight to the bottom. The Events section is the story of what happened to your pod, told in chronological order. Here is what I look for and what it usually means:
- FailedScheduling - your cluster is full, or you have a node selector or taint that nothing satisfies. I hit this most often after someone sets a CPU request higher than any node can provide.
- Failed with a pull error - typo in the image name, a tag that does not exist, or a missing
imagePullSecret. Managed registries like ECR also fail here when your pull-through cache credentials expire. - Unhealthy - your readiness or liveness probe is failing. Nine times out of ten the health endpoint path is wrong or the container has not started listening yet.
- OOMKilled - the Linux kernel killed your process for using more memory than its limit allows. Exit code 137 confirms it.
kubectl logs - Application Output
# Stream logs in real time
kubectl logs -f api-pod-7d4f8b -n production

# Logs from the PREVIOUS container instance (critical for crash loops)
kubectl logs api-pod-7d4f8b --previous -n production

# Logs from a specific container in a multi-container pod
kubectl logs api-pod-7d4f8b -c sidecar-proxy -n production

# Logs from all pods matching a label selector
kubectl logs -l app=api-gateway -n production --all-containers

# Last 100 lines from the past hour
kubectl logs api-pod-7d4f8b --since=1h --tail=100

# Logs with timestamps for correlation
kubectl logs api-pod-7d4f8b --timestamps
The --previous flag is the one I see people forget most often, and it is the one that matters most during a crash loop. Here is why: when a container keeps restarting, by the time you run kubectl logs, you are looking at the new instance that just booted - all you see is a fresh startup. The crash already happened in the last instance. Without --previous, you are reading the wrong logs entirely. I have watched engineers stare at clean startup logs for 20 minutes before realizing this.
stern - Multi-Pod Log Tailing
One limitation of kubectl logs is that it targets a single pod at a time. When you are debugging a deployment with multiple replicas, you need to know which pod is misbehaving, and tailing them one by one is painful. stern solves this. I use it constantly.
# Tail logs from ALL pods matching a regex
stern api-gateway -n production

# Tail logs from all containers in pods with a specific label
stern -l app=api-gateway -n production

# Only show logs from the last 5 minutes
stern api-gateway --since 5m -n production

# Filter log output with a regex (only lines containing "error" or "timeout")
stern api-gateway -n production --include "error|timeout"

# Show logs from a specific container across all matching pods
stern api-gateway -c sidecar-proxy -n production
Stern colour-codes output by pod name, so when three replicas are all streaming logs at once, you can instantly tell which pod produced which line. Install it with brew install stern on macOS, or grab the binary from the GitHub releases.
Common Pod Failure States
Before moving to interactive debugging, here is a quick reference for the failure patterns you will encounter most often. Each has a specific diagnostic path.

| Status | What I Check First | Why |
|---|---|---|
| ImagePullBackOff | kubectl describe pod <pod> | The Events section will show the exact registry error - typo, missing tag, or expired pull credentials |
| CrashLoopBackOff | kubectl logs <pod> --previous | You need the last container's output, not the one that just booted |
| Pending | kubectl describe pod <pod> | Look for FailedScheduling - usually means your CPU/memory request is bigger than any node can fit |
| OOMKilled | kubectl describe pod <pod> | Confirm exit code 137, then decide: raise the limit or profile the app for a leak |
| RunContainerError | kubectl describe pod <pod> | Almost always a bad volume mount or a referenced Secret/ConfigMap that does not exist |
| CreateContainerConfigError | kubectl get cm,secret -n <ns> | Your pod references a ConfigMap or Secret that is missing from the namespace |
Step 3: Interact - Get Inside the Container
When logs and describe are not enough, you need to get your hands dirty.
kubectl exec - Shell Access
# Open an interactive shell (bash if available, sh as fallback)
kubectl exec -it api-pod-7d4f8b -n production -- /bin/sh

# Run a one-off command without entering the shell
kubectl exec api-pod-7d4f8b -- env
kubectl exec api-pod-7d4f8b -- cat /etc/resolv.conf
kubectl exec api-pod-7d4f8b -- curl -s localhost:8080/health

# Target a specific container in a multi-container pod
kubectl exec -it api-pod-7d4f8b -c sidecar-proxy -- /bin/sh

# Check network connectivity to another service
kubectl exec api-pod-7d4f8b -- nslookup database.production.svc.cluster.local
kubectl exec api-pod-7d4f8b -- wget -qO- http://backend-svc:8080/ping
The -- separator trips up everyone at least once. Without it, kubectl tries to interpret your container command's flags as its own. I once spent ten minutes trying to figure out why kubectl exec mypod -- ls -la worked but kubectl exec mypod ls -la gave me a cryptic error. The double dash is the boundary between "flags for kubectl" and "command for the container."
My first five moves once I have a shell:
env | grep -i database(or whatever service is failing) - Did the secret actually make it into the environment? Missing env vars cause more outages than I care to admit.cat /etc/resolv.conf- Is the pod resolving DNS inside the cluster? Ifsearchdoes not include your namespace, service discovery will break silently.ls -la /app/config/- Is the ConfigMap or Secret volume actually mounted? An empty directory here means your volume mount path is wrong.curl -v localhost:8080/health- Does the app respond on the port you think it does? Use-vso you can see connection refused vs. timeout vs. 500.ps aux- Is the process even running? I have debugged containers where the entrypoint script silently failed and left a zombie shell.
kubectl debug - When exec Is Not Enough
Here is a scenario that will happen to you eventually: you run kubectl exec and get back OCI runtime exec failed: exec failed: unable to start container process: exec: "/bin/sh": stat /bin/sh: no such file or directory. Your container image has no shell. Teams building for production strip everything out of their images for security, which is the right call - until 2am when you need to figure out why the service is returning 503s. This is where kubectl debug saves you.
# Attach an ephemeral debug container to a running pod
kubectl debug -it api-pod-7d4f8b --image=busybox --target=api-container

# Create a debug copy of a pod with a different image
kubectl debug api-pod-7d4f8b -it --copy-to=debug-pod --image=ubuntu -- bash

# Debug a node directly (like SSH but through Kubernetes)
kubectl debug node/ip-10-0-1-47.ec2.internal -it --image=ubuntu

# After node debug, chroot to access host tools
# (inside the debug container):
# chroot /host
# systemctl status kubelet
# journalctl -u kubelet --no-pager -n 100
# df -h
That last one - node debugging - is a lifesaver on EKS. AWS does not give you SSH access to managed nodes by default, and setting up SSM Session Manager just to check disk space is overkill. With kubectl debug node/, you get a privileged pod on that specific node. Everything on the host lives under /host in the debug container, so run chroot /host first and then you can use systemctl, journalctl, df, and every other tool on the machine as if you had SSH-ed in directly.
Security note: Node debug is the Kubernetes equivalent of SSH-as-root. It creates a privileged pod with host filesystem access and should be treated as a break-glass operation. In production clusters, RBAC should restrict kubectl debug node/ to a small group of platform engineers or an on-call role. Most application developers should never need it. Always delete the debug pod when you are done (kubectl delete pod <debug-pod-name>) - leaving a privileged pod running on a node is a security risk.
kubectl port-forward - Local Access to Cluster Services
# Forward a local port to a pod
kubectl port-forward pod/api-pod-7d4f8b 8080:8080 -n production

# Forward to a service (load-balanced across backing pods)
kubectl port-forward svc/database 5432:5432 -n production

# Forward to a specific deployment
kubectl port-forward deploy/api-gateway 8080:8080 -n production

# Listen on all interfaces (useful in remote dev environments)
# CAUTION: exposes the forwarded port to all network interfaces
kubectl port-forward --address 0.0.0.0 svc/grafana 3000:3000 -n monitoring
Port-forward is my favourite way to access internal services during debugging. No ingress rules, no load balancer changes, no security group modifications. Just a direct tunnel from your laptop to the cluster.
Step 4: Resolve - Fix the Problem
kubectl rollout - Deployment Lifecycle
# Watch a deployment rollout in real time
kubectl rollout status deployment/api-gateway -n production

# View rollout history
kubectl rollout history deployment/api-gateway -n production

# Roll back to the previous version
kubectl rollout undo deployment/api-gateway -n production

# Roll back to a specific revision
kubectl rollout undo deployment/api-gateway --to-revision=3 -n production

# Trigger a rolling restart (picks up new ConfigMap/Secret values)
kubectl rollout restart deployment/api-gateway -n production
I use rollout restart at least once a week. The scenario: you update a ConfigMap or rotate a Secret, deploy it with kubectl apply, and then wonder why nothing changed. The existing pods are still running with the old values baked in from when they started. You need a restart, but deleting pods one by one is tedious and risks downtime. rollout restart does it properly - a graceful rolling restart that respects your pod disruption budgets and keeps your service available throughout.
kubectl scale - Adjust Capacity
# Scale a deployment up
kubectl scale deployment/api-gateway --replicas=5 -n production

# Scale down (including to zero for cost savings)
kubectl scale deployment/batch-processor --replicas=0 -n staging

# Scale a StatefulSet
kubectl scale statefulset/redis --replicas=3 -n production
kubectl apply and delete - Declarative Changes
# Apply a manifest file
kubectl apply -f deployment.yaml

# Apply an entire directory of manifests
kubectl apply -f ./k8s/

# Dry run to see what would change without applying
kubectl apply -f deployment.yaml --dry-run=client -o yaml

# Generate a starter manifest (great for quick prototyping)
kubectl create deployment nginx --image=nginx:1.27 --dry-run=client -o yaml > deployment.yaml

# Delete resources by label
kubectl delete pods -l app=api-gateway -n staging
I stopped writing Kubernetes YAML from scratch years ago. The --dry-run=client -o yaml pattern generates a valid manifest that you can pipe into a file and edit. It is faster than copying from documentation, and you know the output is syntactically correct because kubectl itself produced it.
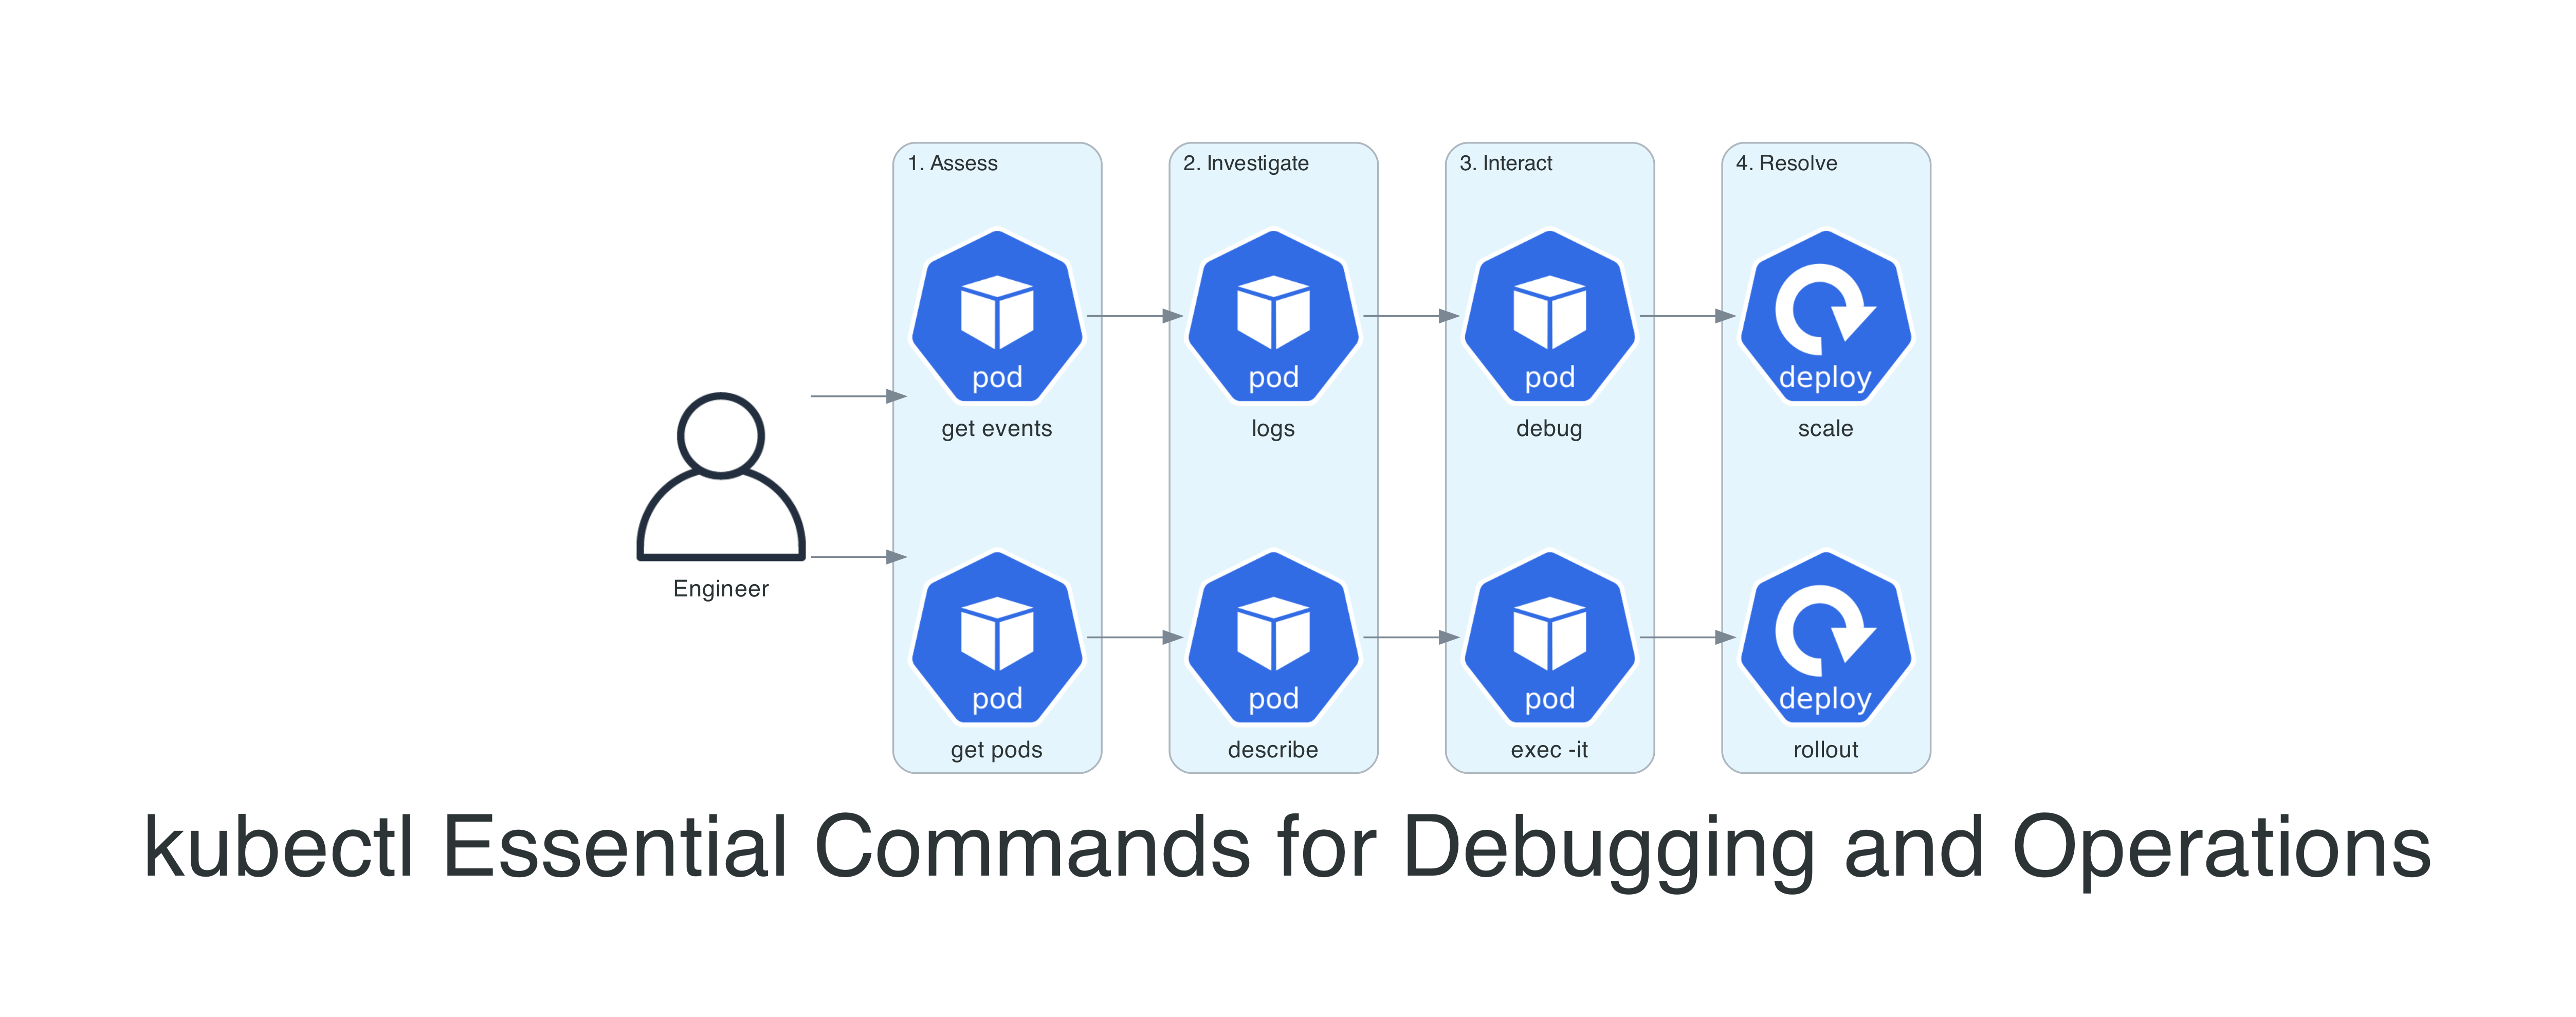
The Debugging Workflow
Here is how all of these commands fit together as a systematic workflow. When something goes wrong, follow this path from left to right.

- Assess:
kubectl get pods -o wideandkubectl get events --sort-by='.lastTimestamp'to understand the current state - Investigate:
kubectl describe podto read events and conditions, thenkubectl logs --previousfor application errors - Interact:
kubectl execfor containers with a shell,kubectl debugfor distroless images or node-level issues - Resolve:
kubectl rollout undoto roll back,kubectl rollout restartto pick up config changes, orkubectl scaleto adjust capacity
Power User Techniques
JSONPath - Extract Exactly What You Need
The default table output from kubectl is fine when you are eyeballing things, but the moment you need to feed data into a script, a Slack alert, or a CSV report, you need structured extraction. JSONPath and custom-columns let you pull exactly the fields you want in one command, no piping through grep and awk required.
# List all container images running in a namespace
kubectl get pods -n production -o jsonpath='{range .items[*]}{.metadata.name}{"\t"}{.spec.containers[*].image}{"\n"}{end}'

# Find pods without resource limits (a common compliance issue)
kubectl get pods -A -o jsonpath='{range .items[*]}{.metadata.namespace}{"\t"}{.metadata.name}{"\t"}{.spec.containers[*].resources.limits}{"\n"}{end}' | grep -v "cpu\|memory"

# Get all node IPs
kubectl get nodes -o jsonpath='{.items[*].status.addresses[?(@.type=="InternalIP")].address}'

# List pods and their nodes in a custom table
kubectl get pods -o custom-columns=NAME:.metadata.name,NODE:.spec.nodeName,STATUS:.status.phase,RESTARTS:.status.containerStatuses[0].restartCount -n production
Context Management - Work Safely Across Clusters
# List all available contexts
kubectl config get-contexts

# Switch to a different cluster
kubectl config use-context staging-cluster

# Set a default namespace for the current context
kubectl config set-context --current --namespace=production

# View the full kubeconfig
kubectl config view --minify
If you manage multiple clusters, do yourself a favour and install kubectx and kubens. Typing kubectx staging is much faster than the full kubectl config use-context command, and kubens production beats remembering to add -n production to every single command.
kubectl auth can-i - Check Your Permissions
Before you run a command that fails with a cryptic RBAC error, check whether you actually have permission first. I use this constantly when working with service accounts or when I have landed in an unfamiliar cluster where I am not sure what my role allows.
# Can I create pods in production?
kubectl auth can-i create pods --namespace production

# Can I delete deployments cluster-wide?
kubectl auth can-i delete deployments --all-namespaces

# What can I do in this namespace? (full list)
kubectl auth can-i --list --namespace production

# Check permissions for a specific service account
kubectl auth can-i get secrets --namespace production --as=system:serviceaccount:production:api-sa
The --as flag is particularly useful when you are debugging why a pod's service account cannot reach a resource. Rather than deploying, waiting for the error, reading logs, and guessing, you can test the exact permission from your terminal in seconds.
kubectl diff - Preview Before You Apply
# See exactly what would change before applying
kubectl diff -f deployment.yaml

# Diff an entire directory of manifests
kubectl diff -f ./k8s/
This is the "measure twice, cut once" command. Before you kubectl apply a changed manifest, diff shows you a coloured unified diff of what will change in the cluster. I have caught wrong namespace targets, accidental replica count changes, and resource limit typos this way. It costs five seconds and has saved me from multiple rollbacks.
Label and Field Selectors - Bulk Operations
# Delete all failed pods in a namespace
kubectl delete pods --field-selector=status.phase=Failed -n production

# Get pods on a specific node
kubectl get pods --field-selector=spec.nodeName=ip-10-0-1-47.ec2.internal -A

# Get all non-running pods
kubectl get pods --field-selector=status.phase!=Running -A

# Combine label and field selectors
kubectl get pods -l app=api-gateway --field-selector=status.phase=Running -n production
Things to Know
- Ephemeral containers (kubectl debug) reached GA in Kubernetes 1.25. They were available as a beta feature with the
EphemeralContainersfeature gate from 1.23, but on clusters running 1.23-1.24 your admin needed to have that gate enabled. On anything older than 1.23, you are limited to exec andkubectl debug --copy-to(which creates a copy of the pod with a different image). Ephemeral containers - the ones that attach to a running pod without restarting it - are the part that required 1.25. - Events expire after one hour by default. If you are investigating an issue that happened earlier, events may already be gone. Use a log aggregation tool (CloudWatch, Datadog, Grafana Loki) for historical event data.
- kubectl top depends on Metrics Server. If
topreturns an error, the Metrics Server is either not installed or not healthy. Check withkubectl get pods -n kube-system | grep metrics-server. - Port-forward binds to localhost by default. If you need to share access (pair debugging, remote dev environment), add
--address 0.0.0.0but be aware this opens the port to your network. - The
--previousflag only works for the most recent terminated container. If a pod has crashed and restarted multiple times, you only get the last crash's logs. For historical crash logs, you need a log aggregation solution. - Context switching affects your entire terminal session. If you have multiple terminals open, switching context in one does not affect the others - but it is still easy to lose track. The
KUBECONFIGenvironment variable can isolate contexts per terminal session. kubectl applytracks changes using thekubectl.kubernetes.io/last-applied-configurationannotation. If you mixapplyandeditorpatch, the annotation may get out of sync. Pick one workflow and stick with it.- Ingress NGINX is retired as of March 2026. The upstream Kubernetes project has halted maintenance - no further releases, bugfixes, or security patches. Existing deployments still function, but if you are debugging service routing issues, this is context you need. The recommended migration path is Gateway API. See the original announcement and the follow-up statement from the Kubernetes Steering and Security Response Committees for details.
- Kubernetes 1.35 deprecates cgroup v1 support. The
FailCgroupV1kubelet config now defaults totrue, meaning the kubelet will refuse to start on nodes using cgroup v1 unless you explicitly override it. If you are debugging a node that suddenly will not come up after a cluster upgrade to 1.35, check whether the node is still running cgroup v1. Full removal of cgroup v1 support is planned for Kubernetes 1.38. - Current version landscape (April 2026): Kubernetes 1.35.3 is the latest release, with 1.36 scheduled for April 2026. EKS supports 1.35 as of January 2026 in all regions. If you are running an older version, check the EKS version calendar for end-of-support dates.
Wrapping Up
Kubectl is a tool that rewards investment. The commands in this post cover the vast majority of what I do with Kubernetes clusters on a daily basis - from the initial "what is happening" triage through to rolling back a bad deployment or restarting pods to pick up new configuration.
The debugging workflow - assess, investigate, interact, resolve - is the real takeaway. Individual commands are easy to look up. The workflow is what turns a 30-minute incident into a 5-minute fix.
If you are just starting with kubectl, focus on these five commands first:
kubectl get pods -o wide -Akubectl describe pod <name>kubectl logs <name> --previouskubectl exec -it <name> -- /bin/shkubectl rollout restart deployment/<name>
Everything else builds on top of those.
Resources
- kubectl Quick Reference - The official cheat sheet
- Debug Running Pods - Ephemeral containers and debugging workflows
- Troubleshooting Applications - Systematic debugging methodology
- kubectl Command Reference - Complete command documentation
- kubectx & kubens - Fast context and namespace switching
- stern - Multi-pod and multi-container log tailing with colour-coded output
- ktop - Live terminal dashboard for Kubernetes cluster metrics (htop-style)
- kubectl debug documentation - Node-level debugging with kubectl
Connect with me on X, Bluesky, LinkedIn, GitHub, Medium, Dev.to, or the AWS Community. Check out more of my projects at darryl-ruggles.cloud and join the Believe In Serverless community.
Comments
Loading comments...